Proxmox send notifications to telegram
How to configure Proxmox notifications via Telegram API using webhooks.
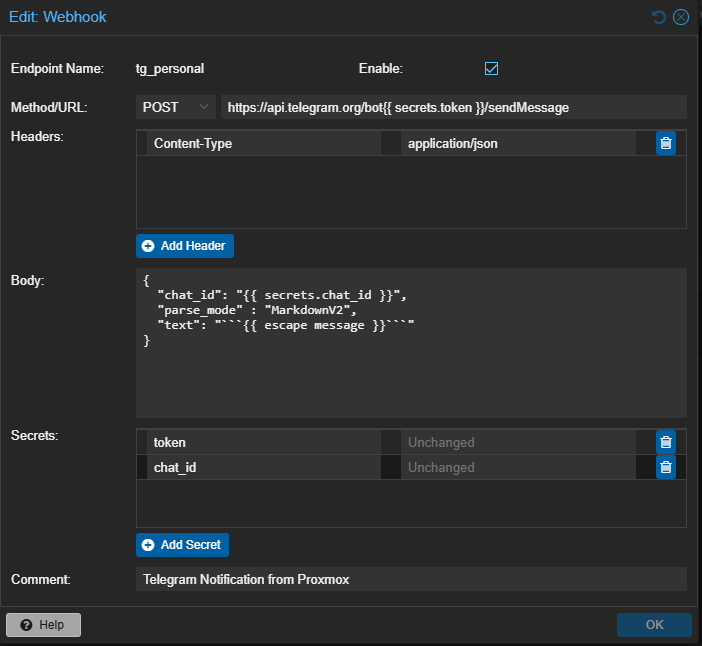
How to configure Proxmox notifications via Telegram API using webhooks.
Jenkins plugins often require specific versions of Jenkins to function. If your log shows errors like Jenkins (2.479.1) or higher required or Update required: [Plugin Name] to be updated to, it means installed plugins are incompatible with your current Jenkins version or require a newer version. Here's how to resolve this by disabling problematic plugins.
Failed to load: [Plugin Name] - Jenkins (X.X.X) or higher required
Failed to load: Matrix Authorization Strategy Plugin (matrix-auth 3.2.5)
 - Update required: Folders Plugin (cloudbees-folder 6.955.v81e2a_35c08d3) to be updated to 6.976.v4dc79fb_c458d or higher
Quick fix:
touch [Plugin Name].jpi.disabled
Ensuring that an email reaches its intended recipient’s mail server is crucial for effective communication. One way to manually verify this is by using Telnet to simulate the sending process. Below, we provide a detailed guide on how to use Telnet to check if a remote mail server is set up to receive emails for a specific mailbox. We will also include possible responses from the mail server, both correct and incorrect, to help you troubleshoot common issues such as spam filters, full mailboxes, and more.
Are you encountering the following error when trying to use yum on your CentOS system?
File "/bin/yum", line 30
except KeyboardInterrupt, e:
^
SyntaxError: invalid syntax
This error typically occurs when the default Python interpreter has been switched from Python 2 to Python 3. Since yum relies on Python 2, pointing the /usr/bin/python symlink to Python 3 causes syntax incompatibilities. In this article, we’ll guide you through resolving this issue and restoring your system’s package manager to working order.
Securing your server’s SSH daemon (SSHD) is crucial to protect against unauthorized access and potential security threats. In this article, we’ll explore the best practices for SSHD configuration, specifically focusing on methods to enhance security by leveraging public key authentication, disabling password authentication, preventing empty passwords, disallowing root login via SSH, and specifying the location for authorized keys. These settings ensure a robust defense mechanism for your server’s SSH access.
Debugging HTTP headers is a crucial task for many web developers and system administrators. This guide will walk you through setting up Nginx to capture and inspect HTTP headers in real-time. Understanding how to efficiently debug these headers using Nginx can save you time and help troubleshoot issues more effectively.
Elasticsearch, a widely used open-source search and analytics engine, often requires the creation of service tokens for authentication purposes. These tokens are typically generated via the command-line interface (CLI) without any issues. However, a recurring problem has been identified when these tokens are used with curl or other types of authentication methods, such as Kibana login.
The error message received is as follows:
received token fails with error
cannot authenticate with auth token to Elasticsearch, error: failed to authenticate service account [elastic/kibana] with token name [<token name>]
In some times you want to receive notifications from grafana only in working hours. You may configure quiet hours, but in this case grafana show status as unhealthy, just not notifying you.
I always have to forget change all internal and external Exchange links (autodiscovery, oof, oab, etc). Therefore I save set of commands in this article.
How to downgrade MS SQL database we can find from web-search. Its discribe simple method – use "Tasks – Generate Scripts…" with data and Win!